- ALL
- #
- a
- b
- c
- d
- e
- f
- g
- h
- i
- j
- k
- l
- m
- n
- o
- p
- q
- r
- s
- t
- u
- v
- w
- x
- y
- z
Showing:
- Abandoned Baby Bottom Pattern
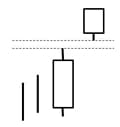
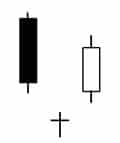 A very rare Japanese candlestick top or bottom reversal signal. It is comprised of a doji star that gaps away (including shadows) from the prior and following sessions’ candlesticks. This is the same as a Western island top or bottom in which the island session is also a doji.
 - Abandoned Baby Top Pattern
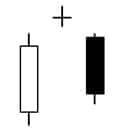 A very rare Japanese candlestick top or bottom reversal signal. It is comprised of a doji star that gaps away (including shadows) from the prior and following sessions’ candlesticks. This is the same as a Western island top or bottom in which the island session is also a doji.
 - Bearish Engulfing Pattern
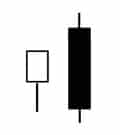 A bearish engulfing candlestick pattern occurs when selling pressure overwhelms buying force as reflected by a long black real body engulfing a small white real body in an uptrend.
 - Belt Hold Line Bearish Pattern
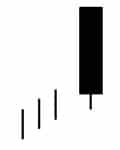 A bearish belt-hold is a long black candlestick that opens on, or near, its high and closes well off its open. Also referred to as a black opening shaven head.
 - Belt Hold Line Bullish Pattern
 A bullish belt-hold is a tall white candlestick that opens on, or near, its low and closes well above the opening price. It is also called a white opening shaven bottom.
 - Bullish Engulfing Pattern
 A bullish engulfing candlestick pattern is comprised of a large white real body that engulfs a small black real body in a downtrend.
 - Candlestick Line Pattern
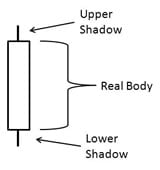 The open and close range are represented by rectangle called the real body (black for a close under the open, white for a close over the open). The lines above and below the real body are called shadows. The top of the upper shadow is the session high and the bottom of the lower shadow is the session low.
 - Counterattack Lines Bearish Pattern
 Following a white candlestick in an uptrend the market sharply higher on the opening and then closes unchanged from the prior session’s close.
 - Counterattack Lines Bullish Pattern
 Following a black candlestick in a downtrend the market gaps sharply lower on the opening and then closes unchanged from the prior session’s close.
 - Dark Cloud Cover Pattern
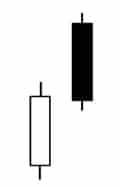
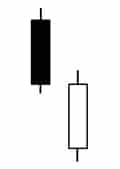
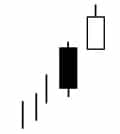
 A bearish reversal signal. In an uptrend a long white candlestick is followed by a black candlestick that opens above the prior white candlestick’s high (or close) and then closes well into the white candlestick’s real body—preferably more than halfway. The bullish counterpart of the dark-cloud cover candlestick pattern is the piercing pattern.
 - Doji Pattern
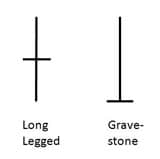 A session in which the open and close on a Japanese candlestick are the same (or almost the same). There are different varieties of doji lines (gravestone, dragonfly, and long-legged doji) depending on where the opening and closing are in relation to the entire range. Doji lines are among the most important individual candlestick patterns. They are also components of candlestick patterns. Northern doji are doji that appear during a rally. Southern doji are doji during declines.
 - Dumpling Top Pattern
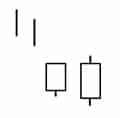
 A candlestick charting pattern that is similar to the Western rounding top. A window to the downside is needed to confirm this as a top. Its bullish opposite is the frypan bottom.
 - Evening Star Pattern
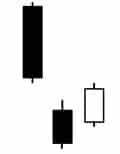
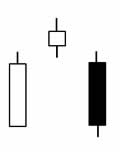 A top reversal pattern formed by three candle lines on a Japanese candlestick chart. The first is a tall white real body, the second is a small real body (white or black) that gaps above the first real body to form a star, and the third is a black candlestick that closes well into the first session’s white real body. If the middle portion of this candlestick pattern is a doji instead of a spinning top, it is an evening doji star. The opposite of the evening star candlestick pattern is the morning star pattern.
 - Falling Three Pattern
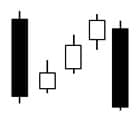 The falling three methods is a bearish continuation pattern. It is ideally comprised of five lines. A long black real body is followed by three small, usually white, real bodies that hold within the first session’s high–low range. Then a black candlestick closes at a new low for the move.
 - Falling Window Pattern
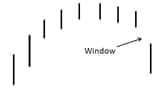
 The same as a Western gap. Windows are continuation candlestick patterns. If a window opens in a selloff, it is a falling window. This is a bearish signal. The falling window is resistance.
 - Frying Pan Bottom Pattern
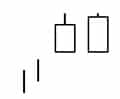
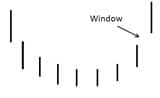 This Japanese candlestick pattern is similar to a Western rounding bottom. A window to the upside confirms this pattern. It is the counterpart of the dumpling top.
 - Gapping Play Falling Pattern
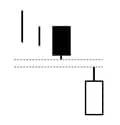
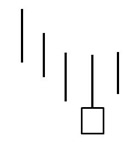
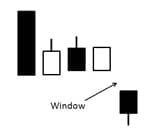 Low-price gapping play. After a sharp price decline, the market consolidates via a series of small real bodies near the recent lows. If prices gap under this consolidation, it is a sell signal in candlestick trading.
 - Gapping Play Rising Pattern
 High-price gapping play—After a sharp advance, the market consolidates via a series of small real bodies near the recent highs. If prices gap above this consolidation area, it becomes a high-price gapping play.
 - Hammer Pattern
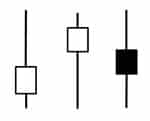
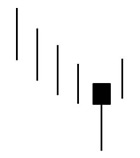 An important bottoming candlestick charting pattern. The hammer and the hanging man are both the same lines that are generally called umbrella lines; that is, a small real body (white or black) at the top of the session’s range and a very long lower shadow with little or no upper shadow. When this line appears during a downtrend, it becomes a bullish hammer. For a classic hammer, the lower shadow should be at least twice the height of the real body when candlestick trading.
 - Hanging Man Pattern
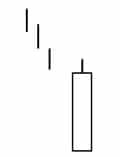
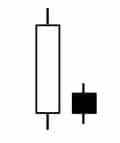
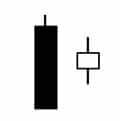
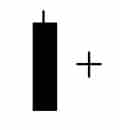
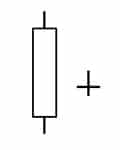
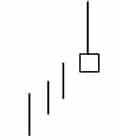
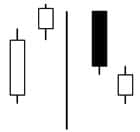
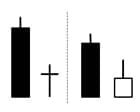
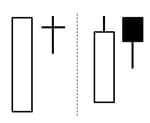
 While many candle patterns will provide you with the understanding of who is controlling the market (buyers vs sellers), there are other concepts to ensure you recognize. The pattern that you see here is called a Hanging Man pattern. A top candlestick reversal pattern that requires confirmation. The hanging man and the hammer are both the same type of candlestick pattern (i.e., a small real body [white or black], with little or no upper shadow, at the top of the session’s range and a very long lower shadow). But when this line appears during an uptrend, it becomes a bearish hanging man. It signals the market has become vulnerable, but there should be bearish confirmation the next session with an open, and better is a close, under the hanging man’s real body. In principle, the hanging man’s lower shadow should be two or three times the height of the real body. An important part of utilizing the Hanging Man pattern is that the hanging man candle itself is only as strong as the confirming, immediately next candle. Meaning, with bearish confirmation, the Hanging Man is a potential bearish candle signal. But remember that this would require a little patience to understand the true meaning of this specific candle pattern. So be sure to understand the importance of what candle patterns are showing, and how they will assist in making the buying/selling decision in your trading. For more information on Candlestick Patterns, please visit our full candle pattern glossary here.
 - Harami Bearish Pattern
 A two-candlestick charting pattern in which a small real body holds within the prior session’s unusually large white real body. The color of the second real body can be white or black.
 - Harami Bullish Pattern
 A two-candlestick charting pattern in which a small real body holds within the prior session’s unusually large black body. The color of the second real body can be white or black.
 - Harami Cross Bearish Pattern
 A two-candlestick charting pattern in which a doji real body holds within the prior session’s unusually large black real body.
 - Harami Cross Bullish Pattern
 A two-candlestick charting pattern in which a doji real body holds within the prior session’s unusually large white real body.
 - High Waves Pattern
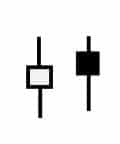
 A candlestick with very long upper and lower shadows and a small real body on a Japanese candlestick chart. It shows that the market is losing its direction bias that it had before this candle appeared. If the real body is a doji instead of a small real body, it is a long-legged doji.
 - Inverted Hammer Pattern
 Following a downtrend, this is a Japanese candlestick line that has a long upper shadow and a small real body at the lower end of the session. There should be no, or very little, lower shadow. It has the same shape as the bearish shooting star, but when this line occurs in a downtrend, it is a bullish bottom reversal signal with confirmation the next session when candlestick trading (i.e., a candlestick with a higher open and especially a higher close compared to the inverted hammer’s close).
 - Morning Star Pattern
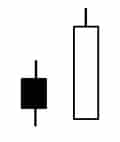
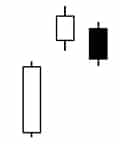
 A bottom reversal pattern formed by three candlesticks. The first is a long black real body, the second is a small real body (white or black) that gaps lower to form a star, and the third is a white candlestick that closes well into the first session’s black real body. Its opposite is the evening star candlestick pattern.
 - Piercing Pattern
 A Japanese candlestick bottom reversal signal. In a downtrend, a long black candlestick is followed by a gap lower open during the next session. This session finishes as a strong white candlestick that closes more than halfway into the prior black candlestick’s real body. Compare to the on-neck line, the in-neck line, and the thrusting line.
 - Rising Three Pattern
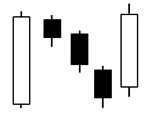 The rising three methods is a bullish continuation pattern. A tall white candlestick precedes three small, usually black, real bodies that hold within the white candlestick’s range. The forth line of this pattern is a strong white candlestick that closes at a new high for the move.
 - Rising Window Pattern
 The same as a Western gap. Windows are continuation candlestick patterns. When the market opens a window to the upside, it is a rising window. It is a bullish candlestick pattern and the rising window should be support.
 - Separating Line Bearish Pattern
 When the market opens at the same opening as the previous session’s white candle and then closes lower as a black candle.
 - Separating Line Bullish Pattern
 When the market opens at the same opening as the previous session’s black candle and then closes higher as a white candle.
 - Shooting Star Pattern
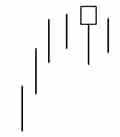
 A bearish candlestick pattern with a long upper shadow, little or no lower shadow, and a small real body near the lows of the session that arises after an uptrend.
 - Side by Side Lines Bearish Pattern
 Two consecutive white candlesticks that have the same open and whose real bodies are about the same size. In a downtrend, on Japanese candlestick charts these side-by-side white lines are still considered bearish (in spite of their white candles since they come after a falling gap).
 - Side by Side White Line Bullish Pattern
 Two consecutive white candlesticks that have the same open and whose real bodies are about the same size. In an uptrend, if these side-by-side white lines gap higher, it is a bullish continuation candlestick pattern. In a downtrend, on Japanese candlestick charts these side-by-side white lines are still considered bearish (in spite of their white candles since they come after a falling gap).
 - Spinning Tops Pattern
 The Japanese candlestick charting nickname for candle lines with small real bodies.
 - Stars Neutral Pattern
 A small real body (white or black) that gaps away from the large real body preceding it. A star in a downtrend has the Japanese candlestick charting nickname raindrop.
 - Tasuki Gap Bearish Pattern
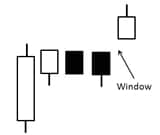
 A bearish gapping tasuki is when the market gaps down with a black candlestick followed by a white candlestick. The last two candlesticks of the tasuki should be about the same size.
 - Tasuki Gap Bullish Pattern
 The bullish gapping tasuki is made of a rising window formed by a white candlestick and then a black candlestick. The black candle opens within the white real body and closes under the white candlestick’s real body. The last two candlesticks of the tasuki should be about the same size.
 - Three Buddha Bottom Pattern
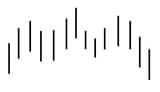
 An inverted three Buddha (Three Buddha Bottom) is the same as the Western inverted head and shoulders. In Japanese charting terminology, it is a three river bottom in which the middle river is the longest.
 - Three Buddha Top Pattern
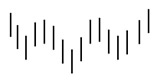
 A candlestick charting three Buddha top is the same as the Western head and shoulders top. In Japanese candlestick terms, the three Buddha top is a three mountain top in which the central mountain is the tallest.
 - Three Crows Pattern
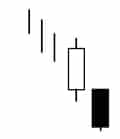
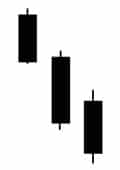 Three relatively long consecutive black candles that close near or on their lows. It is a top candlestick reversal pattern at a high-price level or after an extended rally.
 - Three White Soldiers Pattern
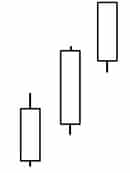 This is a candlestick charting pattern is a group of three white candlesticks with consecutively higher closes (with each closing near the highs of the session). These three white candles presage more strength if they appear after a period of stable prices or at a low price area. Also called Three Advancing Soldiers.
 - Tower Bottom Pattern
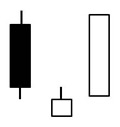
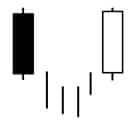 Comprised of one or more long black candles followed by congestion and then one or more long white candlesticks.
 - Tower Top Pattern
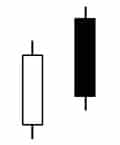
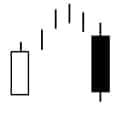 Comprised of one or more tall white candles followed by congestion and then one or more long black candlesticks.
 - Tweezer Bottom Pattern
 When the same lows are tested on back-to-back sessions.
 - Tweezer Top Pattern
 When the same highs are tested on back-to-back sessions.
